First of all, sorry for the delay in getting the results to you. I was out last night, then did a hard 50km ride this morning with a massive hangover! lol (I do mean HARD, Box Hill and back at an avg speed of 31km/h)
Secondly, I have to apologise that the results are NOT complete - I wasn’t aware Surveymonkey only showed first 100 responses in a free account! Unfortunately, I am not going to pay 25quid a month so that I can get some abuse. There are 127 responses in total, so again, sorry to those 27 after the cut-off. The two “f word” responses are partly to blame as they are an utter total waste of space!
Then I realised that you aren’t NO LONGER allowed to download the results in excel format in the free version!!! Therefore, I have just spent the past hour MANUALLY copying/pasting all results from the website…
Now the results.
- Total # of response: 127, of which I can only see 100, less the two “F word”, brings the total to 98
- Out of the 98,
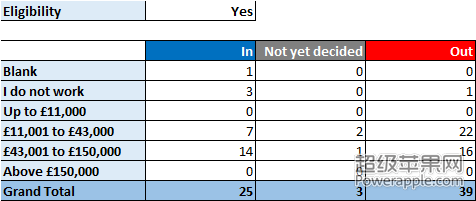
- 67 are eligble to vote
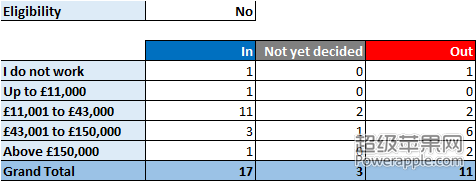
- 31 are not
- Out of the 98,
- In: 42 (43%)
- Not yet decided: 6 (6%)
- Out: 50 (51%)
- Looking at the income band:
- Blank response: 0 (0%)
- I do not work: 6 (6%)
- Up to £11,000: 1 (1%)
- £11,001 to £43,000: 46 (47%)
- £43,001 to £150,000: 41 (42%)
- Above £150,000: 3 (3%)
- I have also dissected the data further based on eligibility and income band, see attached graphs
So, do I have some sort of a conclusion? Of course, I do. However, this is based on a very limited sample size from a very selective group. Anyway, I will not share my thoughts. You are more than welcome to come up with your own theory.
However, one thing I do want to point out is that 45% of the respondents fall into the ‘high rate’ income band and 47% are firmly in the middle bracket. Assume half of the ‘middle bracket’ are making more than £27,000, this means 68.5% of the respondents are above the UK national average salary. So I’d say we are not doing badly financially at all!